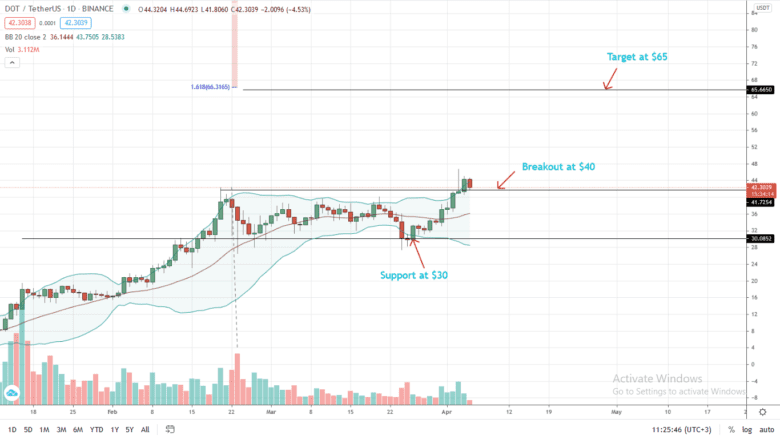
The Polkadot price is defying gravity, starting Q2 2021 strongly by breaking above $40 to post a new all-time high above $45 for an over 45X performance in the past six months alone.
Admittedly, and as per analysts’ projections, Polkadot is just getting started. Even at mega valuations, on-chain data and the wave of partnerships in the sweeping tide of interoperability may significantly boost the DOT price in the short-to-medium term.
At spot rates, the DOT price is up 35 percent versus the greenback, gaining against ETH that’s also posted a new all-time high above $2.1k over the weekend.
Buoying the DOT/USD price is a spike in participation that quickly reversed attempts of lower lows of Apr 3. Notably, DOT’s trading volumes on the last day are within average, dropping 34 percent over the weekend, leaving price action fragile.
Polkadot Price Overview
The path of least resistance for DOT is northwards. DOT bulls broke above the $40 level to register a new all-time high in a bullish breakout pattern with equally high trading volumes.
Participation might be low—considering the holidays, but bulls are unfazed due to the project’s value proposition. Encouragingly, DOT bull bars are beginning to band along the upper BB, suggesting demand in lower timeframes and building momentum for new all-time highs.
Accordingly, the DOT/USD price upside may continue going forward, further pumping determined bulls and Polkadot’s market capitalization.
The $40 will be the support level and a region for loading DOT in the immediate term. As DOT/USD charts new territory, bulls could aim at $65—the 1.618 Fibonacci extension level of the Q1 2021 trade range.
There is no discounting the possibility of the Polkadot price printing above $65. It is especially so if the platform remains attractive to new partners and developers, especially in DeFi and NFTs—two of the most active sub-sectors in crypto.
Polkadot Market Movers
Polkadot is an interoperable platform whose substrate can help projects link to other blockchains, including Ethereum.
The project continues to gain traction, attracting developers keen on building DeFi dApps;
And NFTs.
As the blockchain grows in stature, the number of DOT coins required for staking keeps increasing:
Building on its ecosystem:
At the same time, its ballooning valuation sees Polkadot flips Cardano:
Analysts project the DOT/USD price to reach $70 in the medium-term:
Polkadot Price Prediction

The DOT price is on an absolute tear, outperforming both BTC and USD in the past trading week.
From the daily chart, the DOT/USD price is trading within a bullish breakout pattern. Accordingly, every low above $40 could be a loading point for aggressive traders.
The banding of bull bars along the upper BB suggests a momentum build-up in lower timeframes, a net positive. Accompanying this is the divergence of BB, pointing to volatility—another opportunity for aggressive DOT traders.
With a set price trajectory, DOT bulls can target $66—the 1.618 Fibonacci extension level as the first target.
On the flip side, steep, high-volume losses below $40 pour cold water on this DOT/USD bullish outlook.
Disclaimer: Opinions expressed are not investment advice. Do your research.


