It has been nothing but a sea of red in the last few trading sessions. Chainlink is no exception. LINK losses, if anything, are profound.
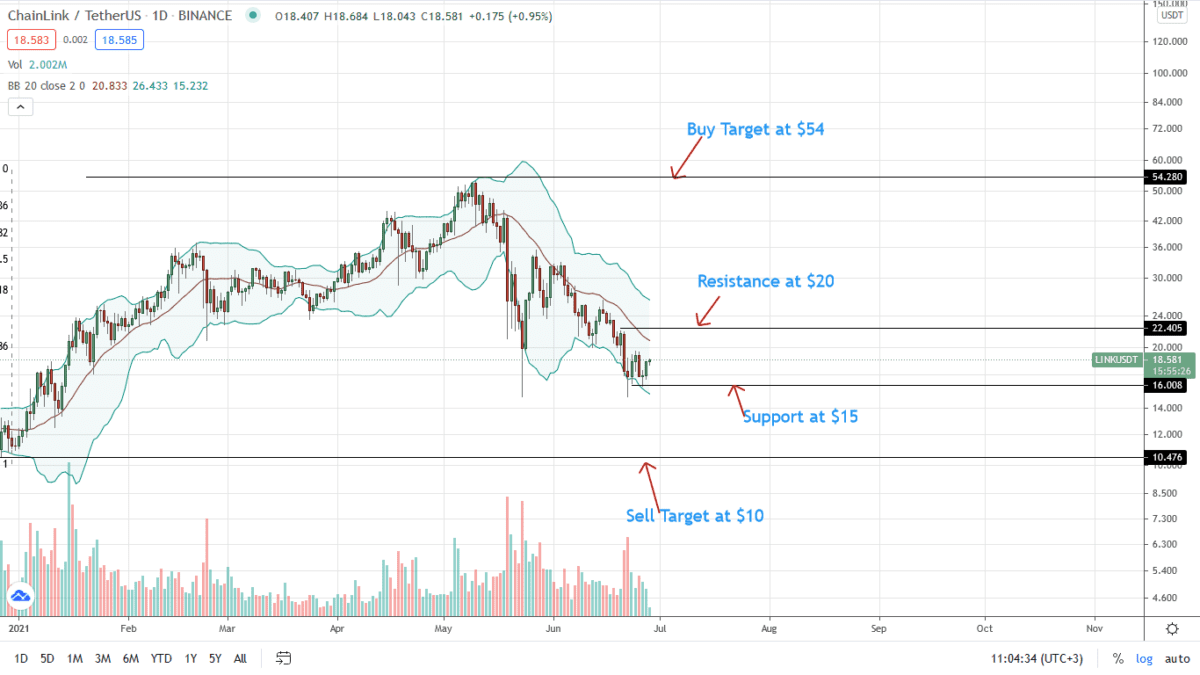
Shedding over 75 percent of the Q1 2021 gains, LINK bears are unforgiving reading from the development in the daily chart.
LINK is stable, adding seven percent on the last trading day but down 16 percent week-to-date at the time of writing.
Even with the flat-lining of LINK/USDT prices on the tail-end of last week, bulls are still struggling.
The good news is, prices are moving within bullish territory of the June 23 conspicuous bull bar.
Nonetheless, provided $20 holds and LINK/USDT prices trade below May 2021 lows, the path of least resistance remains southwards for the time being.
Chainlink Market Overview
The Chainlink price action points to dominant sellers. It is easy to see why.
For one, LINK/USDT price action is slanted negatively.
Despite the horizontal consolidation, the chances of this being a distribution remain high as long as $20 caps LINK/USDT upward advances.
Note that there is a double-bar bullish reversal pattern at the spot rate. On the bright side, this may provide the necessary tailwinds marking the end of sharp losses of the last two months.
The primary support lies at $15 and chances of prices dropping to $10 remain high. This is the 2021 lows and if bears flow back, aligning themselves along the lower BB as is currently the case, losses towards this mark will be high.
At the time of writing, LINK trading volumes are down 10 percent to around $605 million, though bulls are still determined.
Chainlink Market Movers
The blockchain-agnostic project is a middleware linking external tamper-proof data to smart contracts.
It is one of the most adopted, boasting over 300 partners. Chainlink acts as an essential cog in DeFi and NFTs—where their Verifiable Random Function (VRF) has found wide adoption.
Chainlink is distinct because of its decentralization and level of security. It is effective in preventing attack vectors like those using Flash loans:
To keep up with changing times, Chainlink 2.0, as earlier reports show, will incorporate a Layer-2 oracle channel. It is the developer’s grand plan to tackle issues around scalability and front-running.
Coupled with cheap hardware requirements, make Chainlink one of the easiest to run:
Meanwhile, Grayscale Investments are ramping up their LINK holdings:
Chainlink Technical Analysis

From the daily chart, Chainlink prices are down over 75 percent from April 2021 peaks.
LINK/USDT prices now find resistance at around the 78.6 percent Fibonacci retracement level from the January to April 2021 trade range.
This flashes with $20 and the middle BB. Gains above this mark would likely lift the token towards June 2021 highs of around $30.
On the reverse side, a dump down below $15 and last week’s lows open LINK/USDT to $10 and H1 2021 lows.
Disclaimer: Opinions expressed are not investment advice. Do your research.


