The Ethereum price is one of the top performers in the last week of trading.
As of writing on Feb 9, the ETH/USD pair is firm above $1.6k, contracting after racing to a new all-time high of $1,763 on Feb 5.
Following the coin’s success in the last few weeks, ETH is up 25 percent on the last week, 33 percent month-to-date, and 618 percent in the last trading year.
It points to how rampant ETH bulls have been on the last year of trading, riding on the platform’s solid fundamentals.
Even with the optimism, ETH trading volumes appear to be contracting. While the activity may resume on weekdays, average daily trading volumes rose nine percent to $34 billion on the last day.
Ethereum (ETH) Price Overview
Overly, the path of least resistance for the ETH/USD pair is northwards. Buyers appear to be in control, adding to their longs in smaller time frames.
As of writing, ETH prices are around the coin’s all-time. There may be room for more upsides, but that’s highly dependent on the rapidity of the break above $1.763 and the trading volumes.
From price action in the daily chart, Feb 5 high is the immediate resistance level. On the lower side, the 20-day moving average (middle BB) and $1.5k offer support. Losses below this zone can spark a liquidation, possibly marking the end of the uptrend.
Conversely, a break above $1.76k will trigger another wave of FOMO. This development may push ETH/USD prices to $2.1k, the 1.618 Fibonacci extension level of Dec 2020 to Jan 2021 trade range.
Ethereum (ETH) Market Movers
Traders are upbeat on Ethereum, expecting even higher prices.
Like Bitcoin, Ethereum is attracting institutional interest. For instance, acting on behalf of their clients, Grayscale—a crypto fund in the United States, continues to buy more tokens for their clients. In the last week, the fund purchased a whopping 100k ETH.
Beyond ramping up their ETH purchases, Grayscale also filed to register new trusts. Some of these trusts were for AAVE and UNI tokens. These are governance tokens of leading DeFi tokens. According to analysts, institutional investors are keeping a close on DeFi, waiting to ride on gains.
Amid this, the number of wallets with balances of more than 0.1 ETH rose to a new all-time high.
The only undoing, impacting user experience is the rising Gas prices. It makes it hard for new users to experiment with DeFi and Ethereum in general.
ETH/BTC Price Analysis

ETH is Technically Bullish Versus BTC.
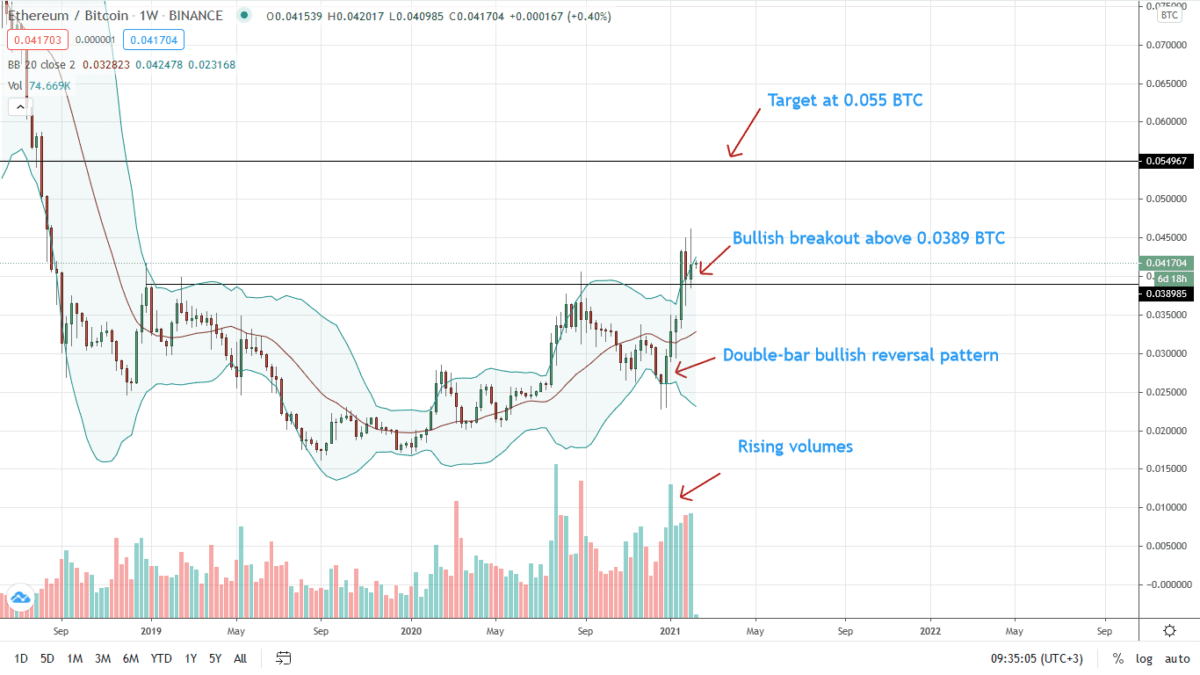
The coin is specifically trading within a bullish breakout level. ETH is at a five-month high versus the BTC from the weekly chart, breaking above Sep 2020 highs of 4182 Sats with relative ease.
Notably, the upsurge builds on early Jan 2021 gains. Throughout the ETH rally, participation volumes are relatively high, pointing to participation.

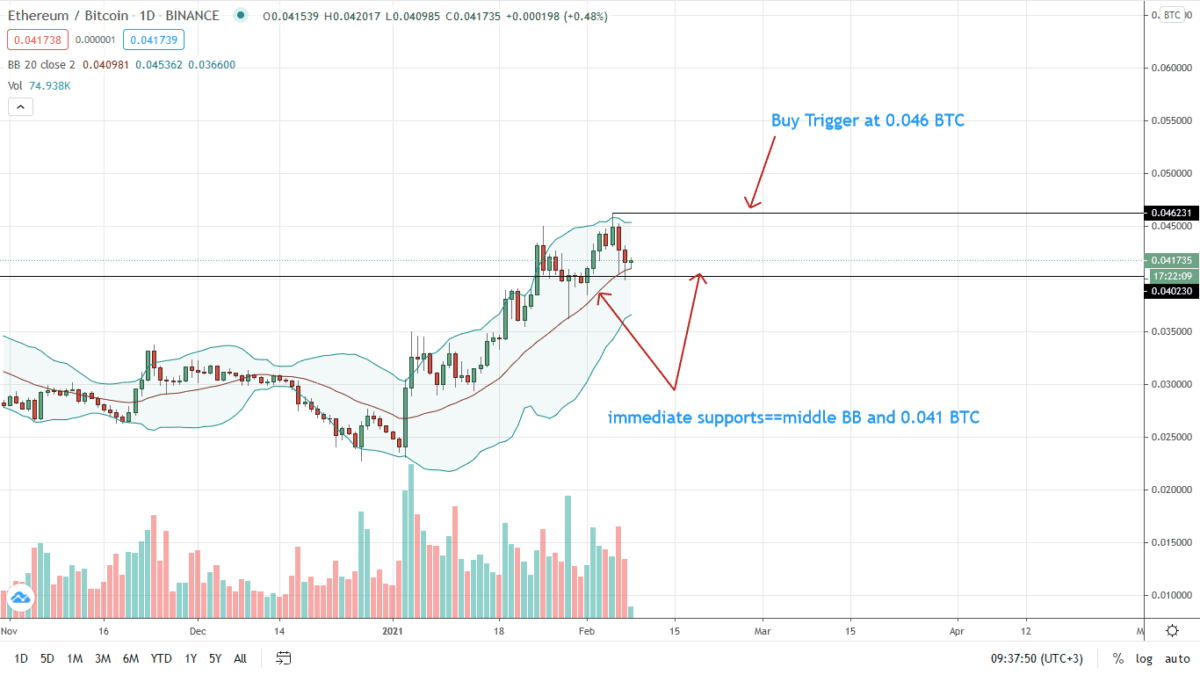
From the daily chart, every low is technically a loading opportunity. Immediate support is at 4182 Sats and the middle BB (20-day moving average). High volume losses below these levels could pave the way for BTC bulls to push back prices to Nov 2020 highs of 3350 Sats.
Conversely, rejection of bear pressure and a break above 4630 Sats opens up ETH to 5400 Sats.
Disclaimer: Opinions expressed are not investment advice. Do your research.


