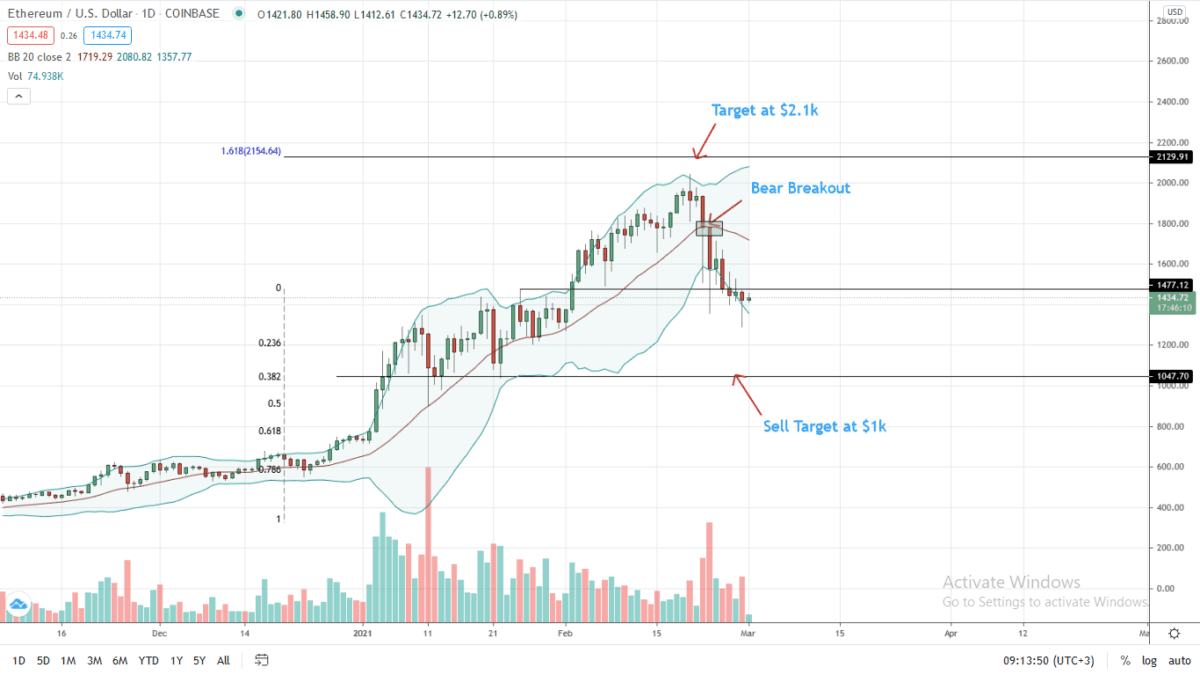
The Ethereum price is plunging, shedding 26 percent week to date. It is nonetheless steady on the last day.

Notably, ETH losses mirror the performance of most crypto assets—outside of stablecoins. Confirming losses of last February 2021, most are in red, free-falling amid a resurgent greenback buoyed by supportive fundamentals.
As of writing on March 1, sellers are in control.
From the daily chart, trading volumes are picking up, suggesting movement from traders looking to exit their positions and book profits. It follows a sharp rise in prices over the last three months following the announcement of the Beacon Chain mainnet and subsequent activation.
Trackers reveal that volumes steadied over the weekend. Still, traders are closely monitoring how ETH/USD prices react at key support levels.
Ethereum Price Overview
From the daily chart, sellers are in control.
In the immediate term, the first reaction point to the upside is 2017 highs of around $1.48k. For technical analysts, this is a reaction point—a retest level that should hold (it didn’t), that’s now acting as resistance. Notably, it marks February 28 highs.
The breakout below $1.5k could signal the potential for a deeper retracement back to $1k—the 23.6 percent Fibonacci retracement, and even to $650—in the medium term.
A concern for optimistic bulls is how the prices’ degradation is with relatively high trading volumes—as of last week. Prices are also banding along the lower BB—pointing to high sell momentum, in an ETH/USD price action trading within a bearish breakout pattern.
Accordingly, for buyers to be in control, ETH/USD prices must rally back above $1.5k—confirming Jan 2021 highs as a retest level. Ideally, the revival ought to be with high trading volumes—preferably exceeding those of February 23.
If not, sellers may continue pressing the sell pedal, potentially forcing ETH prices back to $1k—or worse, $650, as aforementioned.
Ethereum Market Movers
Ethereum is a smart contracting platform and the home of decentralized finance (DeFi).
In the past few weeks, rising Gas prices dominated headlines. Peaking at around $38, Gas prices have more than halved to $11, much to network users’ relief.
However, the falling of Gas could be attributed to migration to competing platforms like Binance Smart Chain (BSC). The latest being the 1inch Exchange who pins their migration to the EVM-compatible BSC to high fees in Ethereum.
Meanwhile, following the Grayscale Bitcoin Trust, its Ethereum Trust (ETHE) is also trading at a discount. For the first time, it sold at 5.17 percent below ETH prices, a discount–for the first time since 2017.
Ethereum (ETH) Price Prediction

Sellers Are in Control
The ETH/USD price is free-falling, down 26 percent week-to-date.
Trading in a bear breakout pattern, every high is potentially a selling opportunity for aggressive traders. Notice that bars are banding along the lower BB, pushing ETH prices below Jan 2021 highs—below the retest level.
Therefore, the first bear target, especially if today’s bar confirms yesterday’s sellers, is $1k—the 38.2 percent Fibonacci retracement level of the December to Jan 2021 trade range.
Further losses could push ETH prices back to Beacon Chain mainnet launch levels of around $650—the 78.6 percent Fibonacci retracement level of the same trade range.
Conversely, a sharp reversal of ETH prices back above $1.5k—or February 28 highs, is enough to confirm Jan 2021 highs as support. This completes the retest, setting the foundation for a possible buy trend pattern continuation.
Disclaimer: Opinions expressed are not investment advice. Do your research.


